- Information visualization
-
Informationsvisualisierung (engl. Information Visualization) ist ein Forschungsgebiet, das sich mit den computer-unterstützten Methoden zur graphischen Repräsentation großer Mengen von Daten beschäftigt, die nicht unmittelbar mit physikalischen Zuständen oder Vorgängen verknüpft sind. Die bildlichen Darstellungsmethoden sollen helfen, diese Daten auszuwerten und aus ihnen neue Erkenntnisse zu gewinnen.
Gemeinhin wird "Information" begrifflich von "Wissen" unterschieden. So wird auch von der "Informationsvisualisierung" selbst unterschieden die Wissensvisualisierung (engl. Knowledge Visualization) als ein Prozess der Wissensübermittlung (Knowledge Transfer), welcher sich graphischer Mittel jeder Art bedient, auch nicht computer-gebundener.[1] Grundlage für die Wissensvisualisierung sind die lernpsychologischen Vorzüge der visuellen Kommunikationsform.
Inhaltsverzeichnis
Arbeitsbereich
Die Informationsvisualisierung ist ein relativ neu entstandenes interdisziplinäres Gebiet, das unter anderem Methoden und Erkenntnisse der Informatik, Statistik, Data-Mining sowie der Kognitionswissenschaft verwendet. Ziel ist hierbei auch, die Mensch-Computer-Interaktion zu verbessern.
Aufgabenstellung der Informationsvisualisierung ist grundsätzlich die expressive und dabei effektive Darstellung der Datenmuster und der darin enthaltenen Informationen. Expressiv bedeutet, dass alle Daten und nur die Daten in die Visualisierung einfließen. Effektivität besagt, dass sich der Betrachter einer Visualisierung möglichst schnell einen Überblick über die in den Daten enthaltenen Informationen verschaffen können soll. Dabei ist Wahrnehmungseffekten, etwa wie optische Täuschungen, Rechnung zu tragen.
Man unterscheidet im Allgemeinen, ob Visualisierungen zur Präsentation von Informationen dienen oder ob es sich um eine Explorationsvisualisierung auf dem Datensatz handelt.
Seit 2002 erscheint ein Jahrbuch mit dem Titel Information Visualization. Es finden regelmäßig zwei Veranstaltungen statt: die InfoVis und die Visualization.
Beispiele
Citespace Analyse
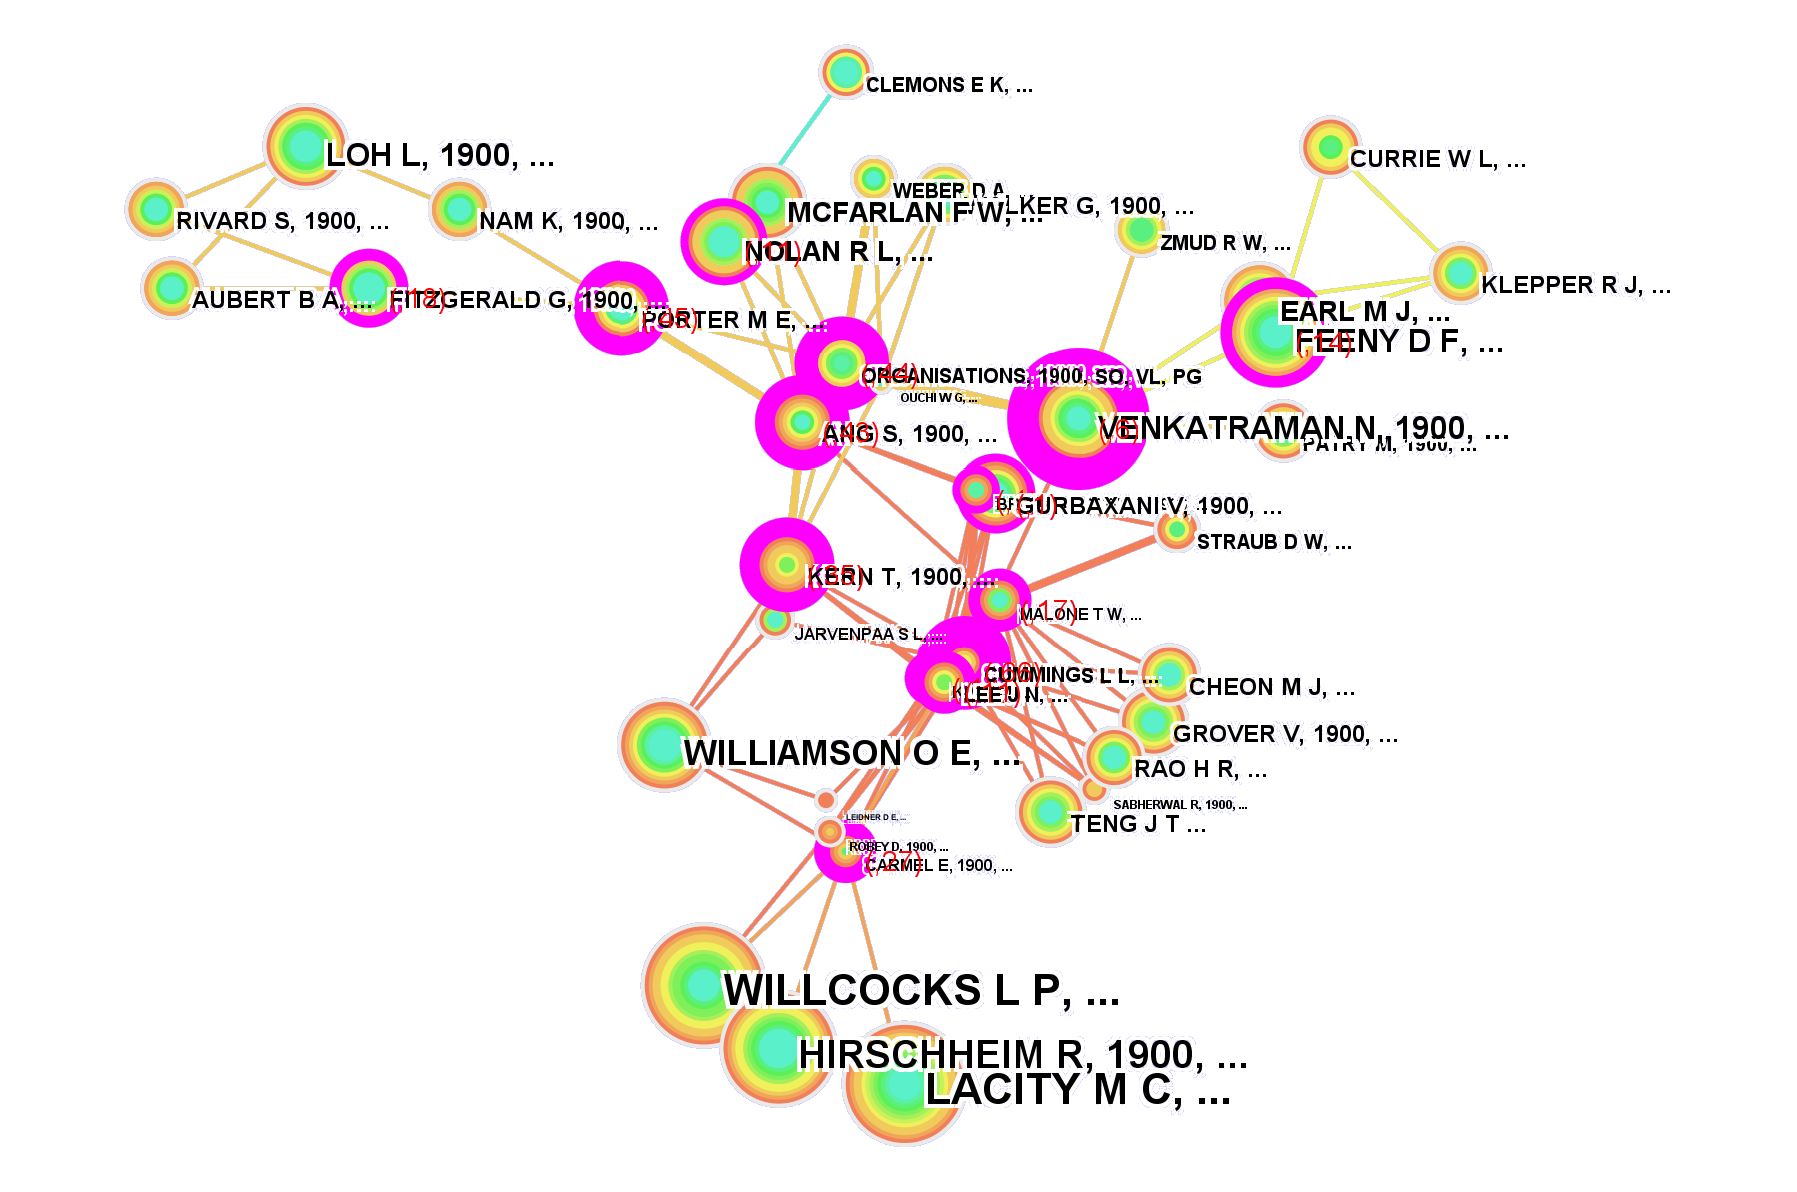
 Ergebnis der Analyse: Publikationen zum Thema Outsourcing
In seinem Artikel Searching for intellectual turning points[2] stellt Chaomei Chen eine Methode für die Analyse von Zitationsräumen dar. Auf seiner Homepage[3] ist ein Tool zur Analyse des Web of Science vorhanden. Darin können nicht nur bibliographische Daten sondern auch die Zitationen von Autoren durch andere Autoren nachverfolgt werden. Die Untersuchung von Cocitation ist eine seit langem bekannte informationstechnische Methode. Neu ist bei Chen die Anwendung von Progressive Pathfinder Network Scaling auf das Problem Cocitation. Diese Analyse arbeitet mit Pathfinder Associative Networks. Der Algorithmus stammt von dem Psychologen Roger W. Schvaneveldt und gehört in den Bereich der Künstliche Intelligenz-Forschung.
Das Tool ist sehr flexibel und bietet die Möglichkeit, andere Analysen wie z. B. autoren- oder publikationsbezogene Clusteranalyse durchzuführen.
Visualisierung von Semantischen Netzwerken
Für den Ontologie-Editor Protégé-2000 existieren verschiedene Visualisierungs-Plugins, die eine Darstellung von Ontologien, bzw. Semantischen Netzwerken im Graphenformat mit variablem Layout ermöglichen[4].
Siehe auch
- Visualisierung (allgemein)
- Visualisierungsprogramme
- Computervisualistik
- Bildwissenschaft
- Informationsdesign
- Kommunikationsdesign
- Computergrafik
- Graphzeichnen
- Data-Mining
- Gebrauchstauglichkeit (usability)
- Information Retrieval
- Wissensmodellierung
- Edward Tufte
- Synopse
- Diagramm (Schaubild)
Literatur
allgemein:
- Stuart Card, Jock Mackinley, Ben Shneiderman (Hsg.): Readings in Information Visualization. Using Vision to Think. Kaufmann, San Francisco 1999
- Chaomei Chen: Information Visualization. Beyond the Horizon. 2. Auflage, Springer London 2004, ISBN 1-85233-789-3
- Chaomei Chen: Mapping Scientific Frontiers. The Quest for Knowledge Visualization. Springer, London, ISBN 1-85233-494-0
- Tamara Munzner, Stephen North (Hsg.): IEEE Symposium on Information Visualization 2003. Seattle, Washington, October 19-21 Los Alamitos-Verlag, Calif. (u.a.): IEEE Computer Soc. 2003, ISBN 0-7803-8154-8
- Ben Shneiderman: The eyes have it: A task by data-type taxonomy for information visualizations. In: Proceedings of Visual Languages 1996 (IEEE 1996), S. 336–343.
- Tergan, Keller: Knowledge and Information Visualization: Searching for Synergies. Springer, Berlin, ISBN 3-540-26921-5
- Colin Ware: Information Visualization : Perception for Design Morgan Kaufmann Series in Interactive Technologies, San Francisco 2000, ISBN 1-558-60819-2
zu Citespace Analyse:
- Roger W. Schvaneveldt (Hsg.): Studies in Knowledge Organization. Pathfinder Associative Networks, Norwood 1989, ISBN 0-89391-624-2
zu Intelligenter Visualisierung
- Visualizing the Semantic Web. XML-based Internet and Information Visualization. Springer, London, ISBN 1-85233-576-9
- Robert Spence: Information Visualization: Design for Interaction (2nd Edition), Prentice Hall, 2007, ISBN 0-132-06550-9.
Einzelnachweise
- ↑ Eppler, Martin, Burkhard, Remo(2004): Knowledge Visualization [10/16/2007]
- ↑ Searching for intellectual turning points: Progressive Knowledge Domain Visualization]. Proceedings of the National Academy of Sciences of the United States of America (PNAS), 101 (Suppl. 1), S. 5303-5310. (Weblink, pdf)
- ↑ http://cluster.cis.drexel.edu/~cchen/citespace/
- ↑ - Visualisierungs-Plugins für Protégé, OntoViz u.a.
Weblinks
- Wikiviz - research notes on Information Visualisation
- Explore Information / Create Knowledge Text zum Thema Informationsvisualisierung, Wissensmedien, Wissenkünste von Wolfgang Strauss et al. Fraunhofer IAIS - MARS - Exploratory Media lab.
- InfoViz Cyberinfrastructure
- InfoVis-Wiki.net: Engl. Wiki über Information Visualization
- see conference - jährliche deutsche Konferenz zum Thema Informationsvisualisierung
- In eigener Sache: WikiVis, Visualisierung der Wikipedia
Wikimedia Foundation.